Generate a Simulated Data Tensor
This notebook demonstrates how to generate a simulated data tensor using the simulated_sparse_tensor() function of the Barnacle library. In this example we generate a mode-3 data tensor from 5 sparse simulated components. We use the barnacle.visualize_3d_tensor() function to visualize the simulated data tensor, as well as the components used to generate the simulation, and we use the barnacle.plot_factors_heatmap() to visualize the factors matrices used to generate the simulation
components.
[1]:
# imports

import numpy as np
import scipy
import tensorly as tl
from barnacle import (
    visualize_3d_tensor,
    simulated_sparse_tensor,
    plot_factors_heatmap
)
[2]:
# generate simulated data tensor

true_rank = 5
true_shape = [15, 20, 10]
true_densities = [.4, .2, .6]

# re-seed simulated data until all factor matrices are full rank
full_rank = False
while not full_rank:
    # generate simulated tensor
    sim_tensor = simulated_sparse_tensor(
        shape=true_shape,
        rank=true_rank,
        densities=true_densities,
        factor_dist_list=[
            scipy.stats.uniform(),
            scipy.stats.uniform(loc=-1, scale=2),
            scipy.stats.uniform()
        ],
        random_state=9481
    )
    # check that all factors are full rank
    full_rank = np.all([np.linalg.matrix_rank(factor) == true_rank for factor in sim_tensor.factors])

# ensure that factor matrices are full rank
for factor in sim_tensor.factors:
    print(np.linalg.matrix_rank(factor))
5
5
5
[3]:
# visualize simulated tensor data

fig = visualize_3d_tensor(
    sim_tensor.to_tensor(),
    shell=False,
    midpoint=0,
    show_colorbar=True,
    label_axes=True,
    range_color=[-1, 1],
    opacity=1,
)

fig.show()
[4]:
# visualize each individual component used to generate the simulated data tensor

for i in range(true_rank):
    component = sim_tensor.get_components()[i]
    fig = visualize_3d_tensor(
        component.to_tensor(),
        shell=False,
        midpoint=0,
        show_colorbar=False,
        label_axes=True,
        range_color=[-1, 1],
        opacity=1
    )
    print(f'Component {i}')
    fig.show()
Component 0
Component 1
Component 2
Component 3
Component 4
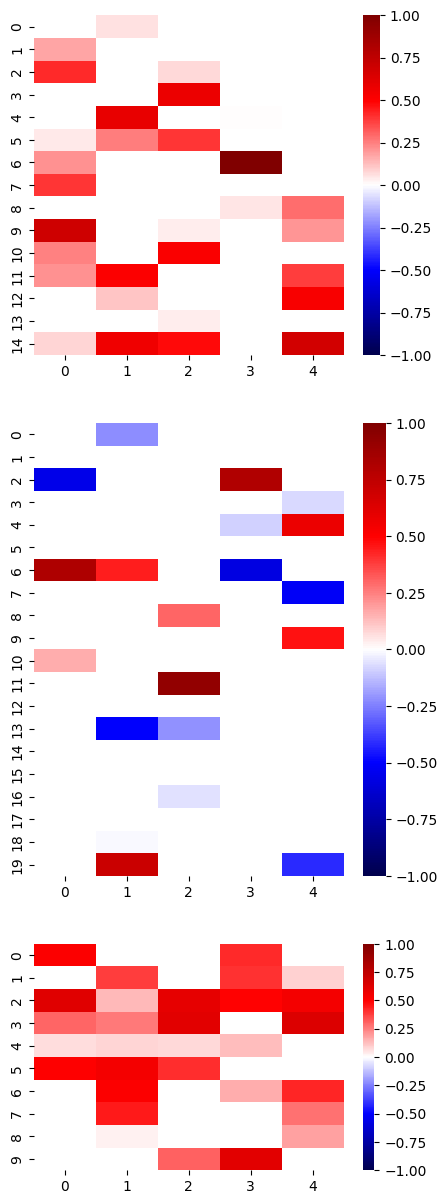
[5]:
# visualize the factor matrices used to generate the simulated data tensor

heatmap_params = {'vmin':-1, 'vmax':1, 'cmap':'seismic', 'center':0}
fig, ax = plot_factors_heatmap(
    tl.cp_normalize(sim_tensor).factors,
    mask_thold=[0, 0],
    ratios=True,
    heatmap_kwargs=heatmap_params
)